Python Trigonometric Function Visualization
The [Coding Druid] series is my cross-platform programming practice notes. Each episode focuses on a theme (math, physics, electronics, graphics, sound...), implemented in several programming languages. Leveling up warrior, mage, healer, and rogue simultaneously — tanking, DPSing, healing, and escaping all at once.
Coding Druid - Math Chapter - Trigonometric Function Visualization:
Python Implementation
In the previous two sections, we visualized trigonometric functions (sine and unit circle) using MaxMSP and JavaScript:
[Coding Druid - Math Chapter] MaxMSP Trigonometric Function Visualization
[Coding Druid - Math Chapter] JavaScript (React) Trigonometric Function Visualization
This time we'll implement it in Python.
Python also has many ways to draw graphics. Fortunately, I'm not very familiar with most of them — being a Python newcomer means less choice paralysis than the JavaScript version.
With the goal of getting results quickly, I directly Googled "python data visualization lib" and among the results, sorted by GitHub stars, found the tried-and-true Matplotlib. And just like that, the decision was made.
![]()
Matplotlib Installation Considering future practice topics, I chose Anaconda's all-in-one installation, which includes Matplotlib and a bunch of scientific computing and data analysis libraries.

Since I've been working from different locations recently with different computers, I set up a remote development environment (VSCode Remote is amazing!). Code is deployed and runs on an Azure server, while I use a netbook for editing and viewing results. So I chose the Linux version for the server.
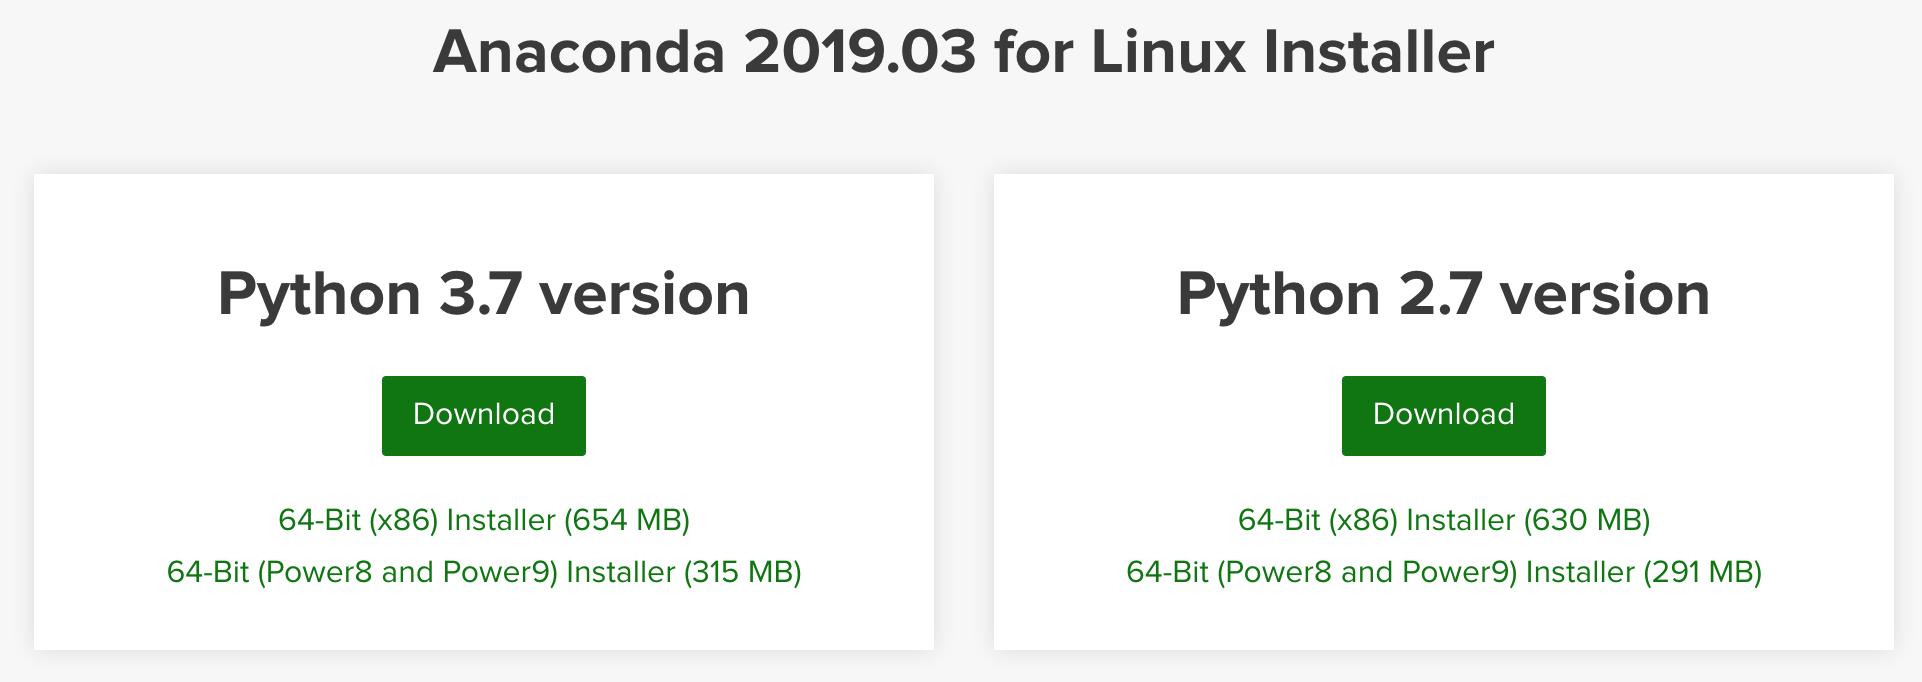
Note: Choose the Python 3.x version on the left, since Matplotlib 3.0+ only supports Python 3.
Matplotlib 3.0 is Python 3 only.
For Python 2 support, Matplotlib 2.2.x will be continued as a LTS release and updated with bugfixes until January 1, 2020.
After installing Matplotlib, we can start coding.
(Actually, after writing a few lines, I found that viewing graphical output remotely wasn't very convenient, so I also installed Jupyter Notebook to write and view results directly in the browser.)
I also installed ffmpeg to convert Matplotlib animations to mp4.
ffmpeg was also installed via Anaconda — gut feeling says fewer pitfalls this way.
conda install -c conda-forge ffmpeg
With Matplotlib, the Sine function animation code is actually just a few lines. Most of the code is actually for coordinate configuration, drawing helper lines, etc.
Code shown below:
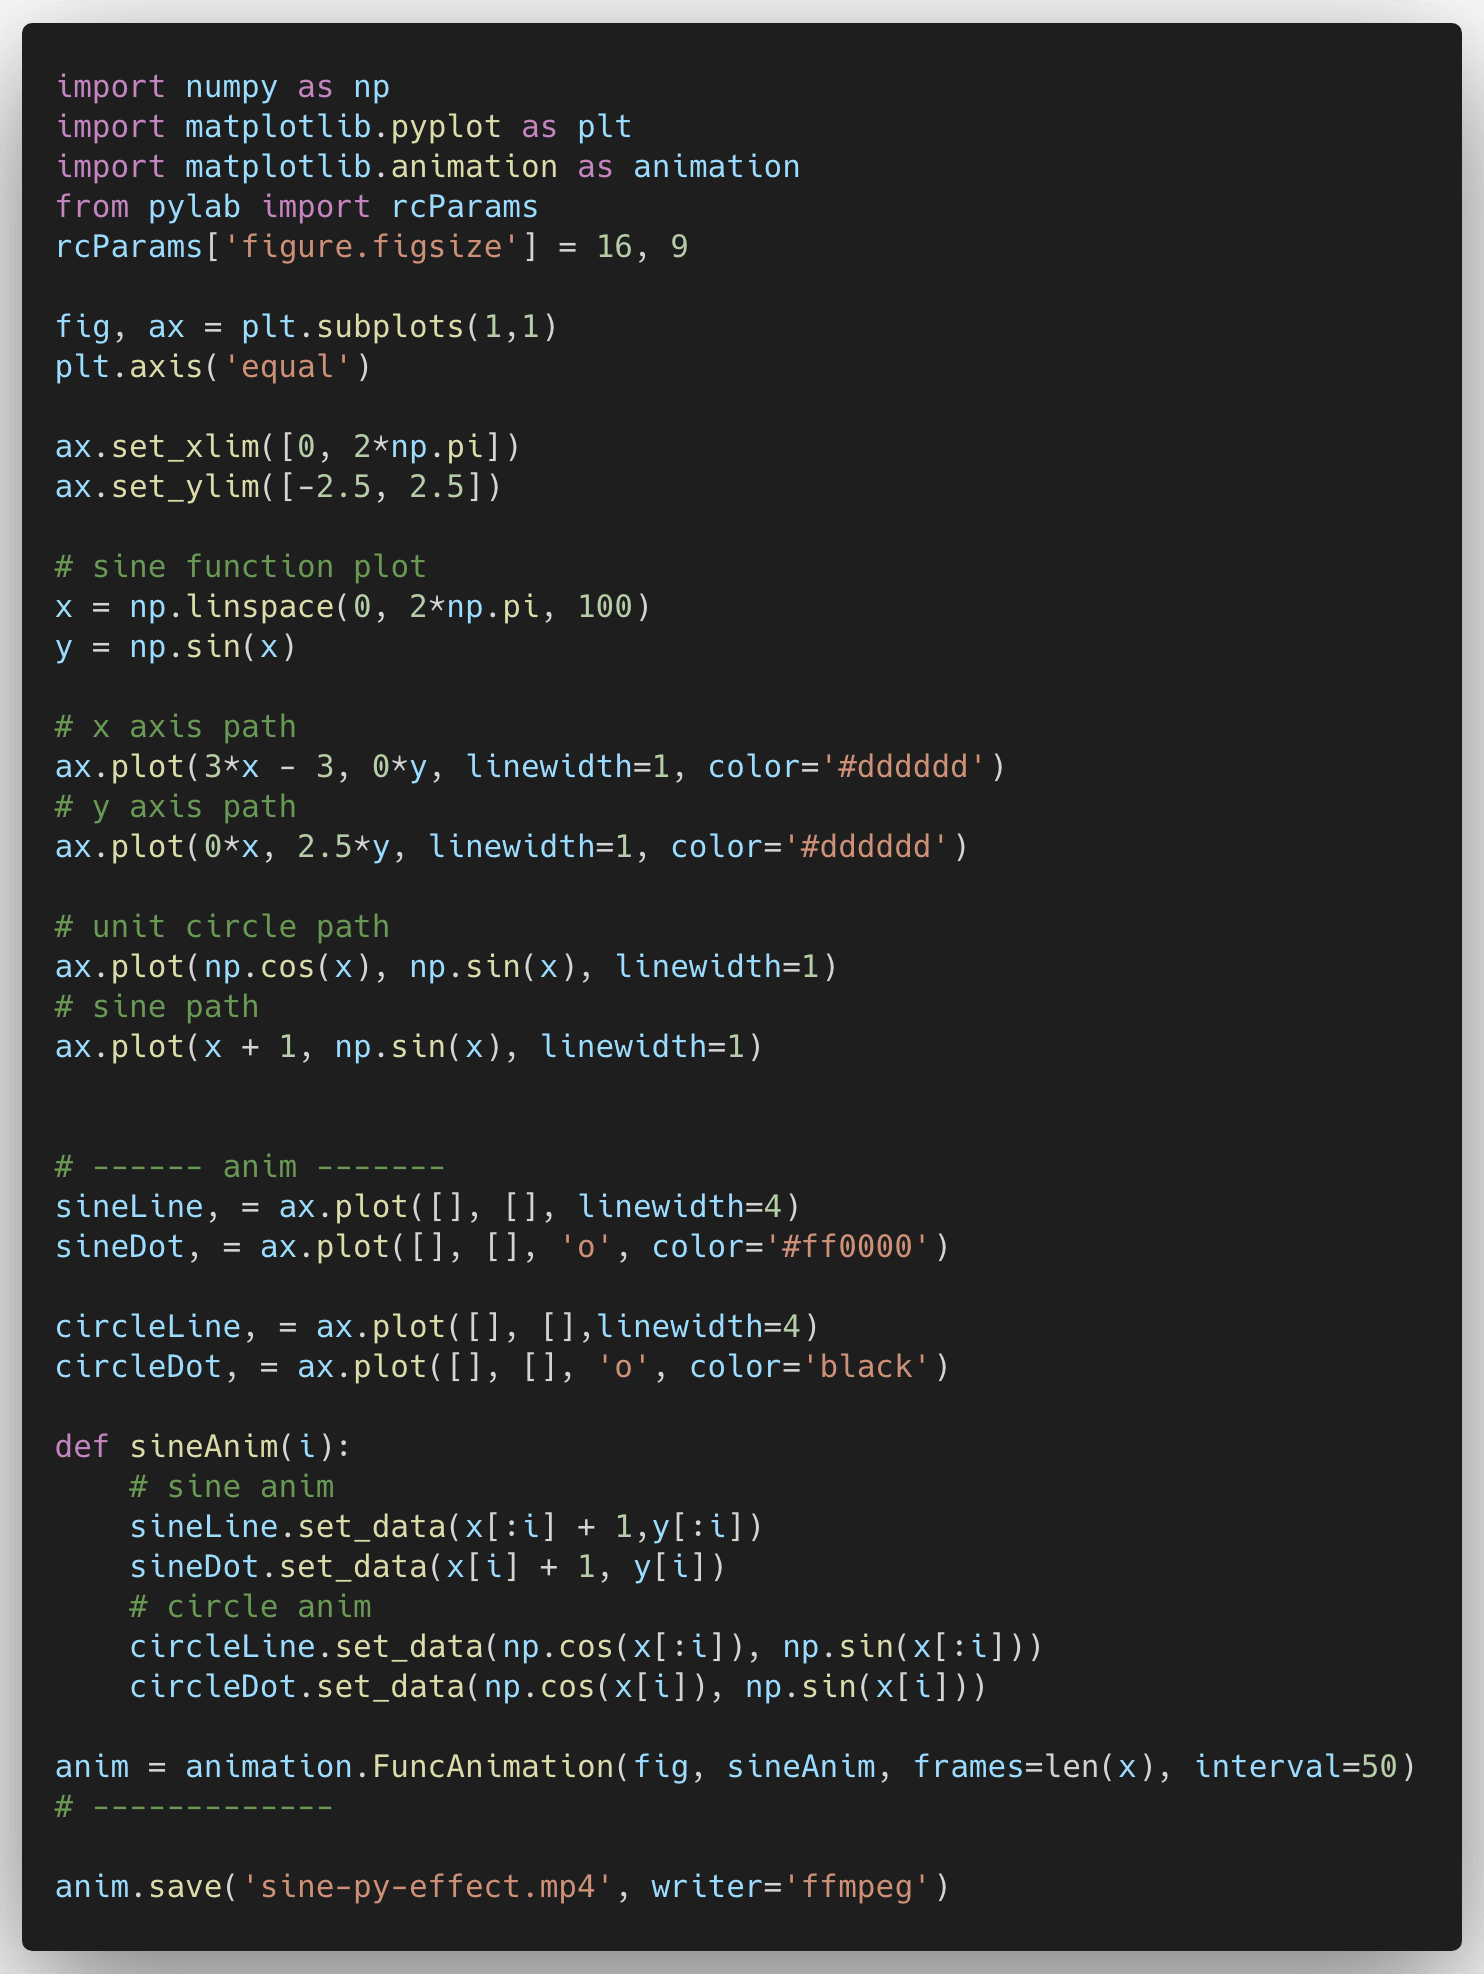
Basically following tutorials and reference articles — when using this kind of library, most of the thinking focuses on the math formula logic itself.
Here's a good reference article: Animations with Matplotlib
Final result:
Talk is cheap. Show me the code!
The code for this and most of the [Coding Druid] series is open-sourced here: https://github.com/avantcontra/coding-druid
Follow us on social media: code2art
Community resources & courses: https://ghc.h5.xeknow.com/s/hzkMX
code2art Intelligence Center (membership): https://ghc.h5.xeknow.com/s/2BCFuJ
Cheers🍻
Contra