JavaScript (React) Trigonometric Function Visualization
The [Coding Druid] series is my cross-platform programming practice notes. Each episode focuses on a theme (math, physics, electronics, graphics, sound...), implemented in several programming languages. Leveling up warrior, mage, healer, and rogue simultaneously — tanking, DPSing, healing, and escaping all at once.
Coding Druid - Math Chapter - Trigonometric Function Visualization: JavaScript (React) Implementation
In the previous section, we visualized trigonometric functions (sine and unit circle) using MaxMSP, which looked like this:
[Coding Druid - Math Chapter] MaxMSP Trigonometric Function Visualization
This time we'll implement it in JavaScript.
There are many ways to draw function curves with JavaScript in a browser:
- Draw directly on Canvas or WebGL
- d3js
- p5js
- pixijs
- SVG + CSS
- And many more
While suffering from choice paralysis, I stumbled upon an example using React + SVG:
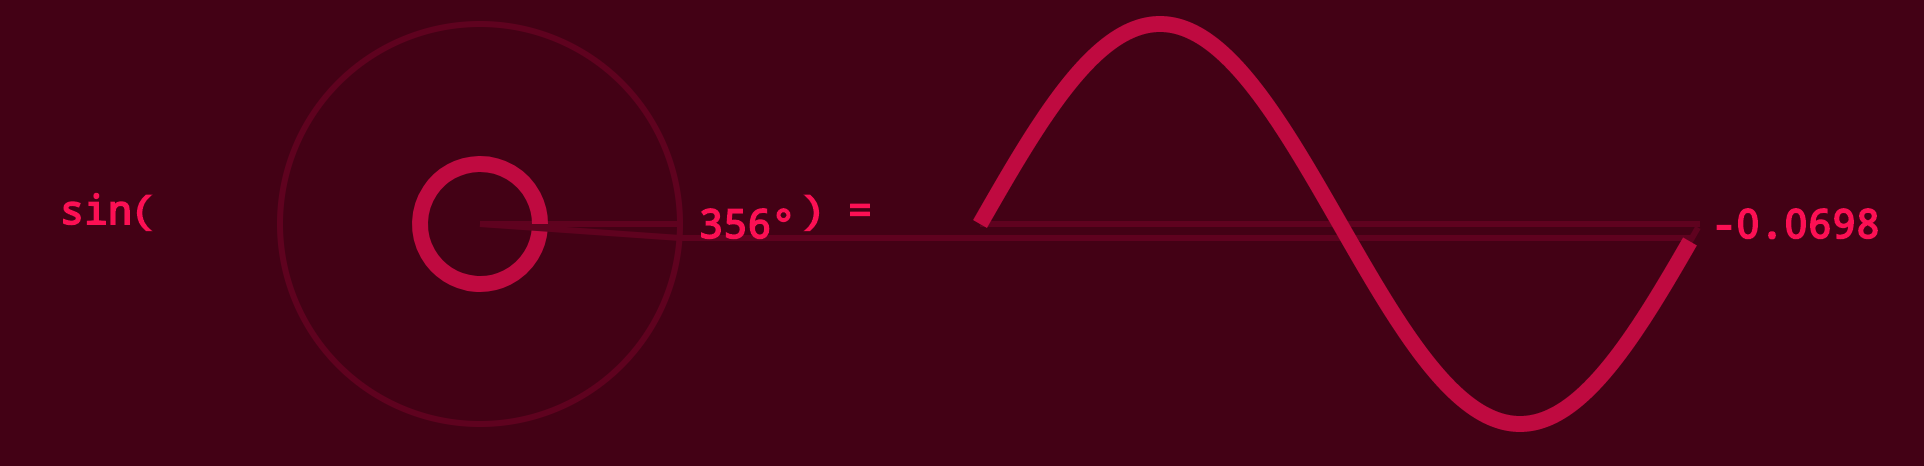
Using SVG to describe the sine function in a declarative way:
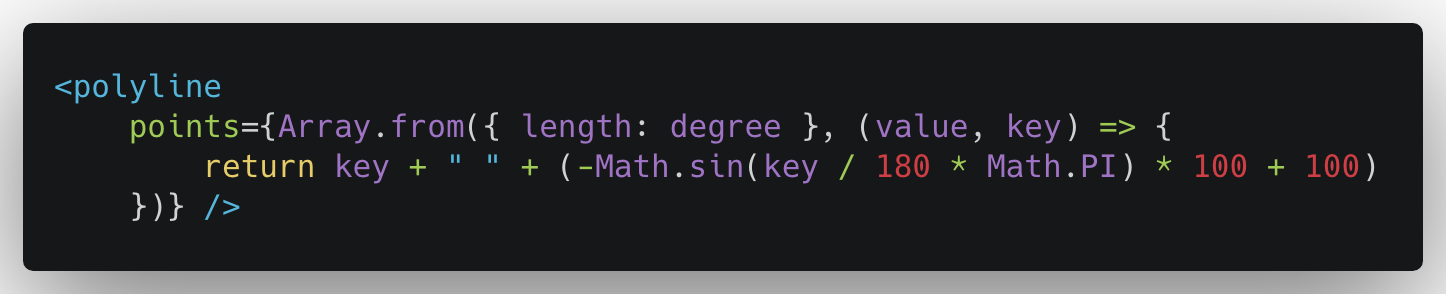
Then leveraging React State's update mechanism to bind and update the degree parameter along the x-axis:
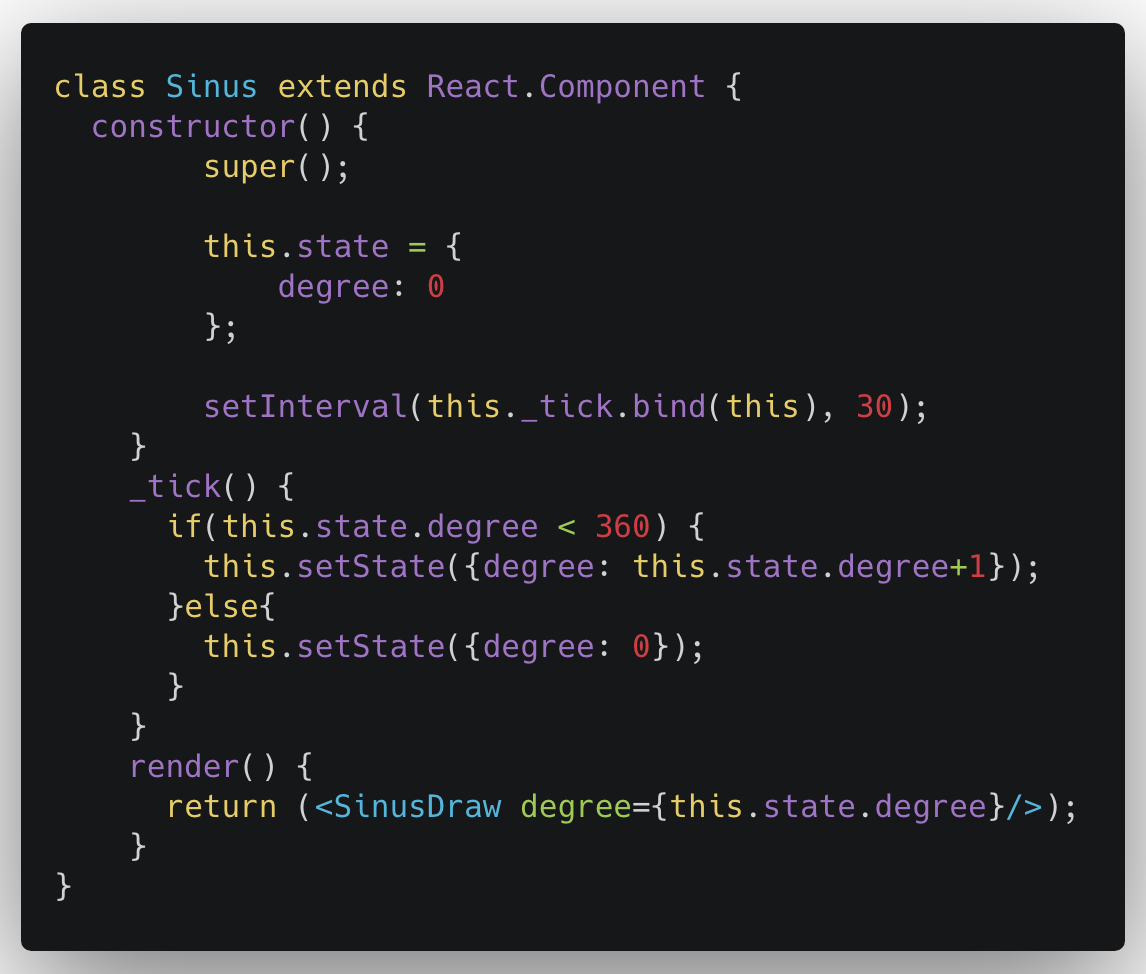
This way, when the degree changes, the sine function dances along — clean and beautiful!
I've rarely used SVG in past projects, and when I did, it was just as a bitmap. This was a good opportunity to learn more — thanks to the author of this example!
As for React, it's been my go-to frontend library for years. But I hadn't looked closely at new features like Hooks in React 16+, so this was another learning opportunity. I refactored the React State parts of the above example using React Hooks.
The official Hooks documentation is excellent — just follow along and refactor the Sinus component:
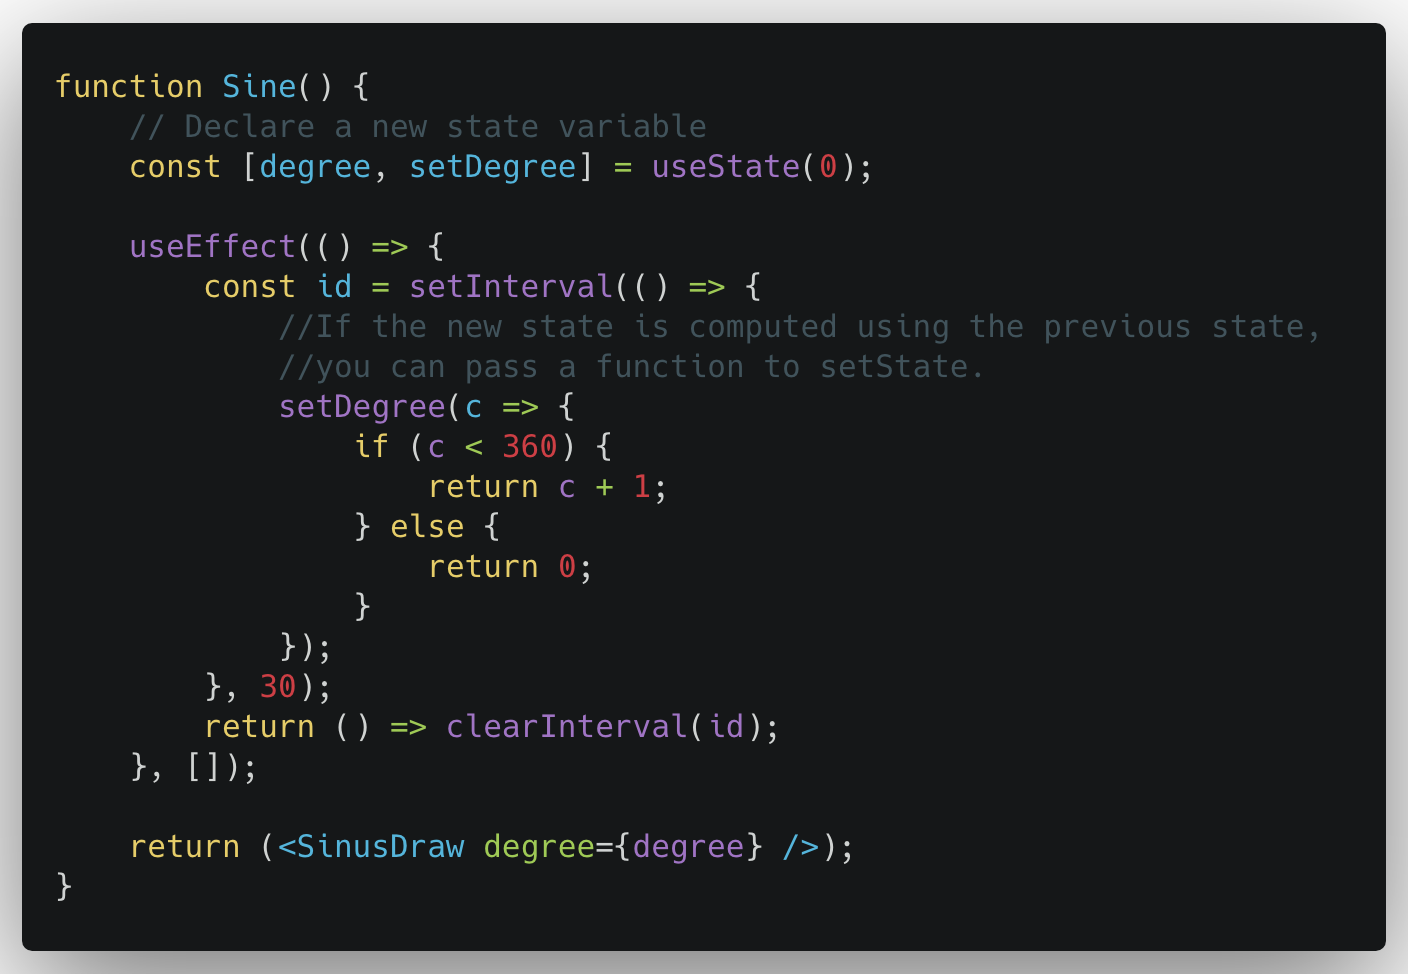
Hooks are simple yet powerful, but watch out for performance issues since useEffect() runs after the first render and every update.
On this topic, the official docs provide some tips.
Final result:
I tweaked the colors slightly to distinguish it from the original example.
Talk is cheap. Show me the code!
The code for this and most of the [Coding Druid] series is open-sourced here: https://github.com/avantcontra/coding-druid
Follow us on social media: code2art
Community resources & courses: https://ghc.h5.xeknow.com/s/hzkMX
code2art Intelligence Center (membership): https://ghc.h5.xeknow.com/s/2BCFuJ
Cheers🍻
Contra