Blender Fourier Drawing
Result of this article:
Preface: In the [Coding Druid] Fourier Series Visualization chapter, we practiced the basic visualization of Fourier series principles, demonstrating how a periodic square wave can be decomposed into a series of sine waves:
Above is the JavaScript (React) version. There's also a Python (Blender) version and a Unity version.
This time, let's apply what we've learned and try the popular "Drawing with Fourier Series" experiment, with as simple and intuitive an explanation of the principle as possible.
A (Hopefully) Simple and Intuitive Explanation
Previous visualizations were all in 2D space. For example, a sine wave:
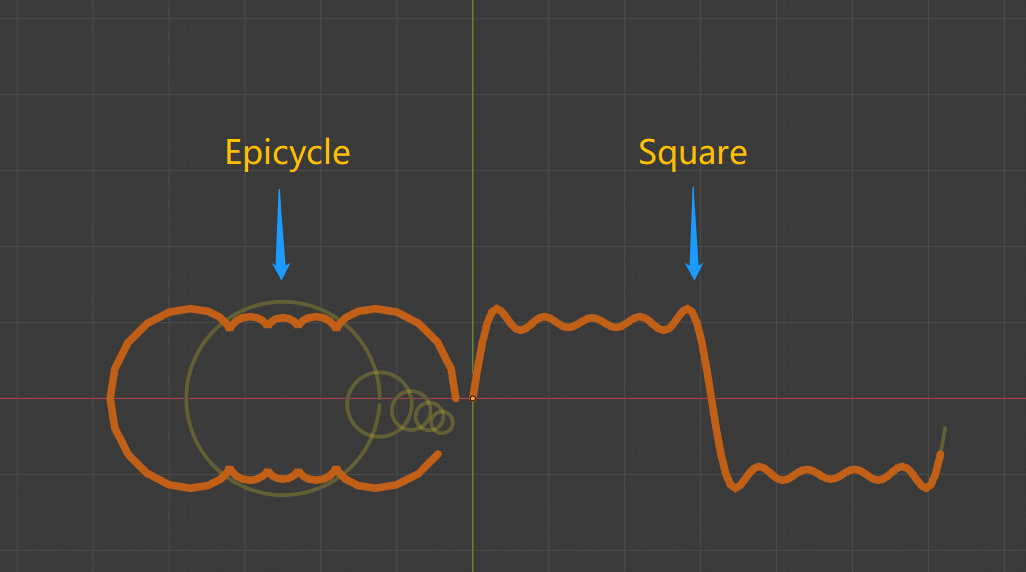
Square wave (via Fourier series):
The relationship between the epicycles on the left and the sine/square wave on the right:
- Left side: a moving point rotating over time t on one or more combined circles (epicycles);
- Right side: time t is mapped to the x-axis, while the y-value of the moving point remains unchanged.
In other words, converting from time domain to spatial domain gives you a sine curve from a circle, or a square wave from a combination of circles.
Let's also draw the trajectories of the moving points on both sides of the square wave visualization:
The epicycle trajectory on the left and the square wave trajectory on the right are actually just different representations of the same moving point in different spaces.
Eureka!!!
To make it even clearer, let's switch from 2D to 3D space, mapping time t to the z-axis instead of the x-axis:
Viewed from the front, it's still a circle. But rotating to a side view in 3D space reveals it's actually a sine curve.
Same for the square wave:
The orange trajectory from the front, viewed from the side, is the square wave curve.
Eureka again!!!
Furthermore, based on Fourier series principles, to get the square wave (orange), we need to find the series of sine waves (golden) that compose it:
From another angle, to get the final trajectory (orange), we need to find the series of epicycles (golden) that compose it:
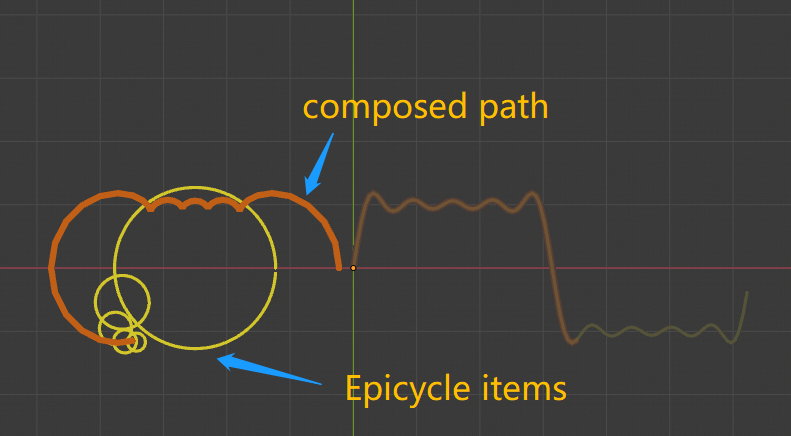
And this orange trajectory can be any shape — meaning whatever figure you want to draw, as long as you find the right set of epicycles following Fourier series principles, you can draw it!
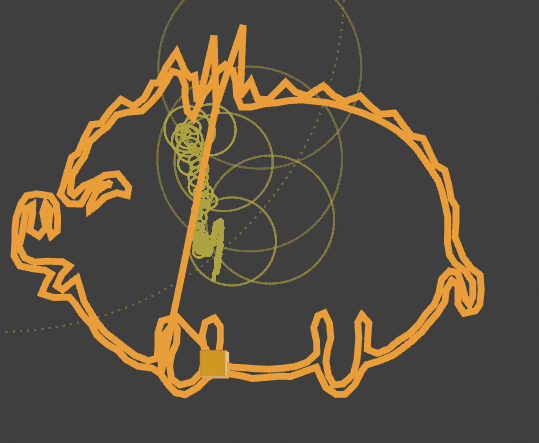
Golden pig:
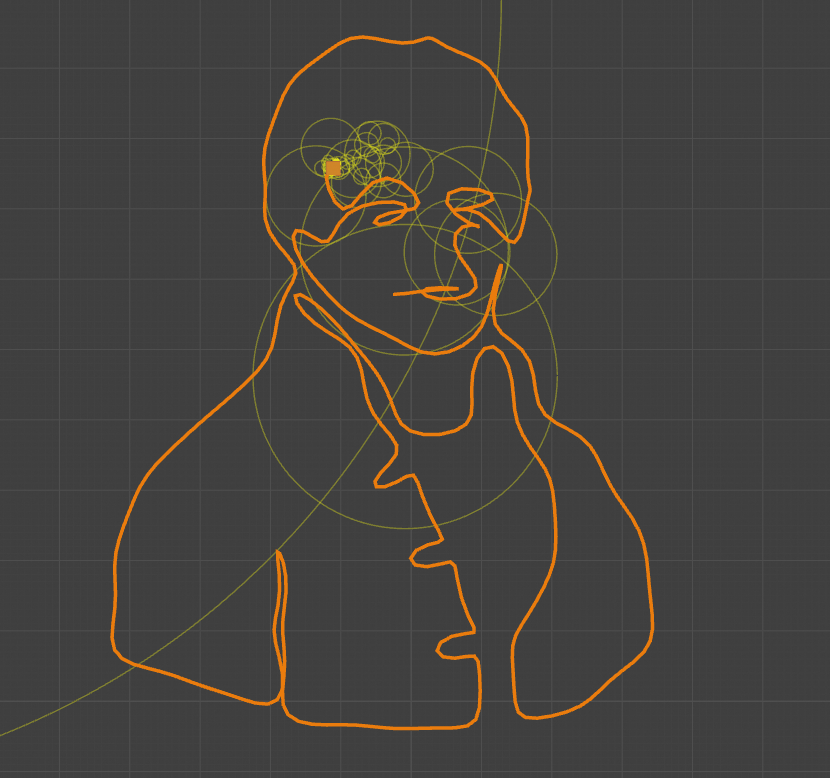
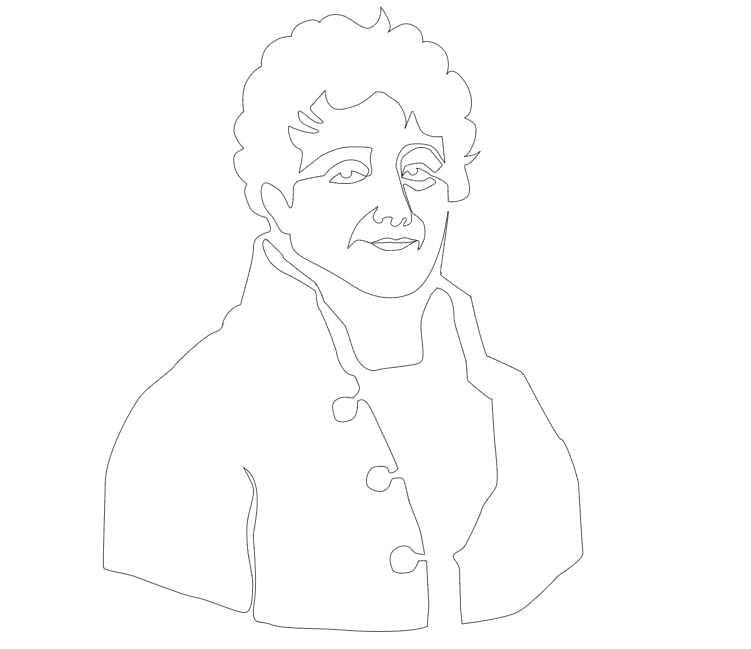
Fourier himself:
How about that — is this an easier way to understand the principle behind Fourier drawing?
The next challenge is how to find the corresponding set of epicycles for "any" pattern.
Mathematically, this means finding the Fourier coefficients (a and b) for each term in the Fourier series.
There are many methods for finding Fourier coefficients — integration, Fourier transform, etc. I haven't fully reviewed the detailed derivations yet, so my answer to "how to put an elephant in a fridge" is still: 1. Open the door; 2. Put the elephant in; 3. Close the door.
Simply apply the Fourier transform to the pattern trajectory to get the Fourier coefficients.
In computer programs, all data is discrete, so what's actually used is the Discrete Fourier Transform.
For this topic, there are many reference resources, especially web frontend/JavaScript/p5.js implementations, listed below.
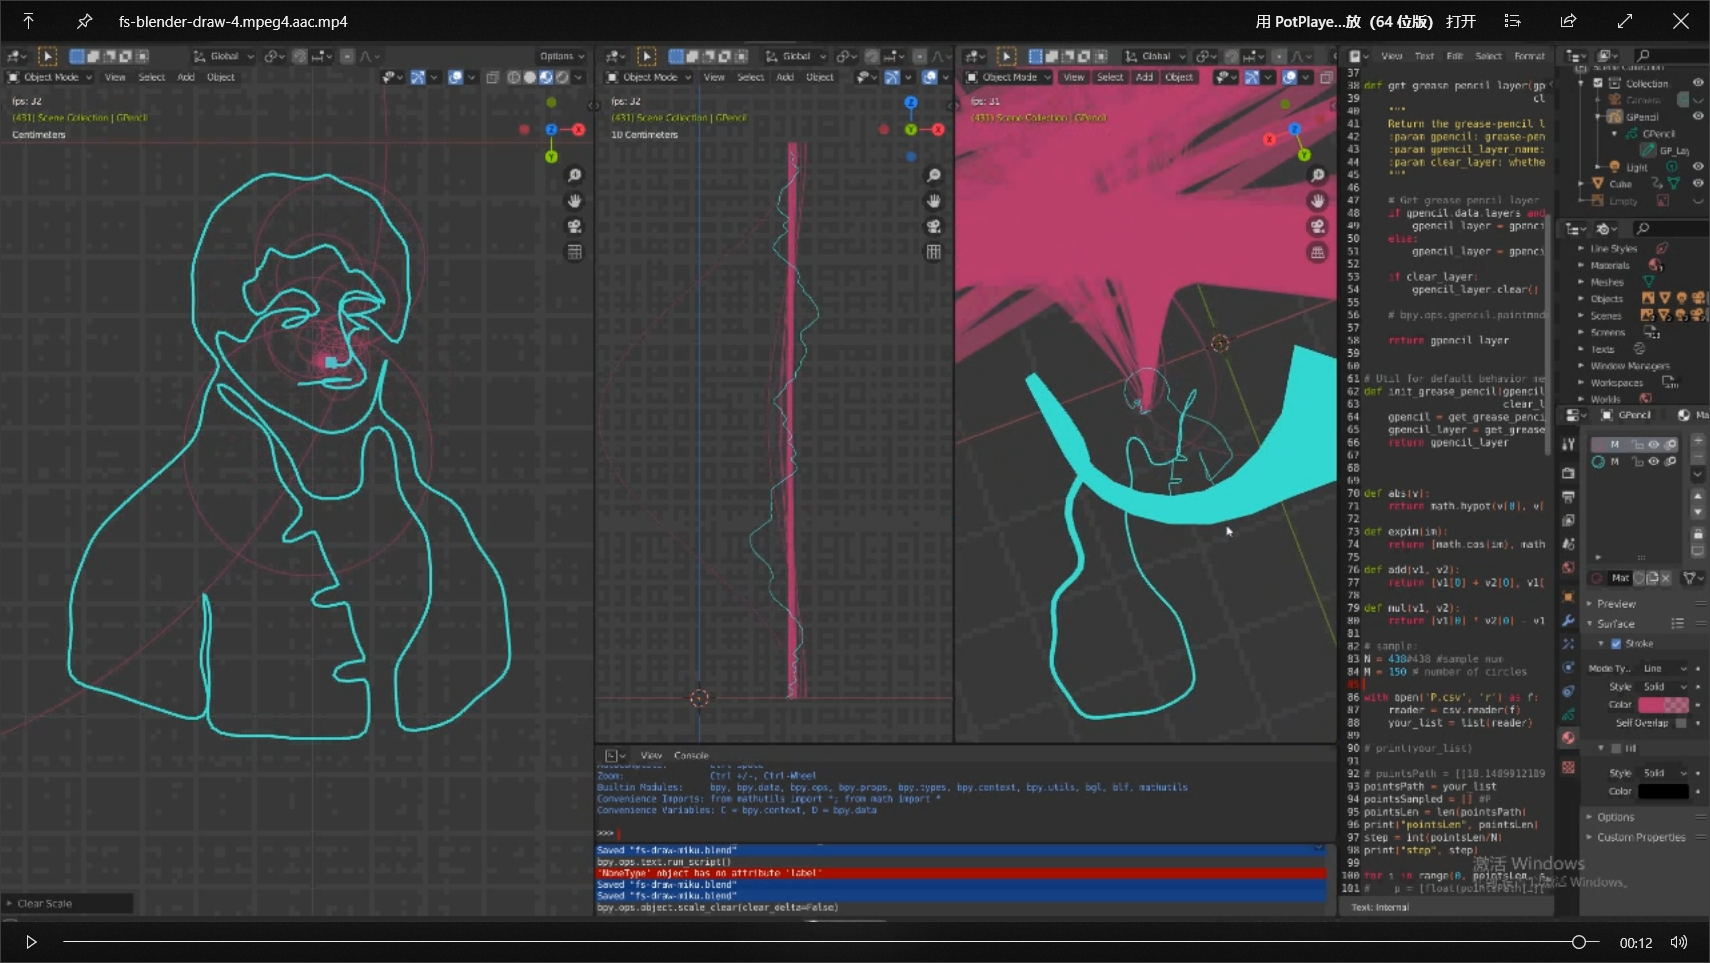
The figures and animations in this article were made with Blender + Python:
Wait — not done yet.
As you can tell from the color scheme of the Fourier portrait, I originally planned to draw Miku (Hatsune Miku):

However, this is where "need meets reality" — the harder part of Fourier drawing is actually finding a suitable contour trajectory, not every image works easily. That's why I put "any" in quotes earlier.
Mathematically, a function can only be expressed as a Fourier series under certain conditions. Finding the optimal contour is far more complex than drawing the trajectory itself. References from others are listed below.
With the effort invested in this article, I could only manage simple contour lines, so Miku was replaced by Mr. Fourier himself 🙂:
Final result (three viewpoints):
References
Learn Python Creative Coding with Blender: Fourier Series Visualization Introductory notes on running Python in Blender.
An Interactive Introduction to Fourier Transforms An excellent frontend JavaScript implementation of Fourier drawing.
Drawing with Fourier Transform and Epicycles Shiffman's explanation and p5.js implementation.
But what is a Fourier series? From heat flow to circle drawings | DE4 3Blue1Brown's brilliant explanation, official Bilibili channel.
Epicycles, complex Fourier series and Homer Simpson's orbit Another excellent explanation, on par with 3B1B!
Step-by-step Guide to Drawing with Fourier Transform Focuses more on obtaining the optimal contour.
Talk is cheap. Show me the code!
The code for this and most of the [Coding Druid] series is open-sourced here: https://github.com/avantcontra/coding-druid
Follow us on social media: code2art
Community resources & courses: https://ghc.h5.xeknow.com/s/hzkMX
code2art Intelligence Center (membership): https://ghc.h5.xeknow.com/s/2BCFuJ
Cheers🍻
Contra